Iterative Theory Formulating the Prophetic Stories
How the stories of key religious figures came from iterating them over generations


I come from the rare and unorthodox point of view that any theological figure —whether it be Mohammed, Jesus, Moses or Buddha — is ‘lost’ to the transcend as their story becomes dispersed wider and wider across the local community. The historical validity of this figure becomes irrelevant as the story becomes integrated into the population’s culture. Furthermore, since human beings can access wisdom from each other during their lifetime and not just from a single figure (dead or alive), as the story is passed from generation to generation, iterations of wisdom are added to the story’s main character (i.e. a prophet) based on the experiences of that generation, forming a more complete and accurate description (or a model with more historical data) of the human experience. In summary, the prophetic stories from Mohammed to Jesus, to Moses, to Buddha are products of iterations of stories across thousands of generations across millions of people.
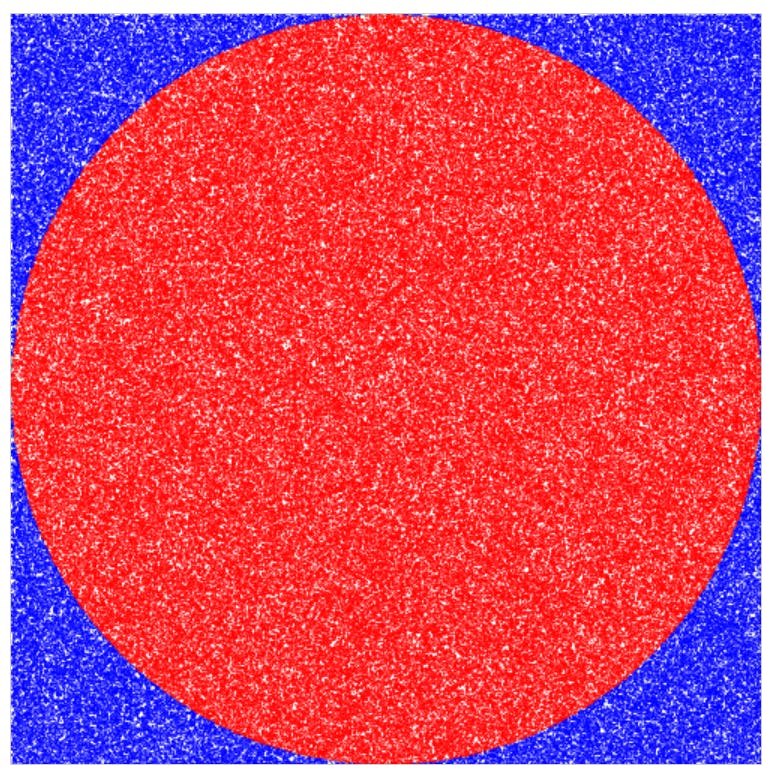
For instance, in mathematics, iterations are widely used to narrow in on an optimum value of a model. The number π is a very special number, somehow a manifestation of something transcendent, like the fire stolen from Zeus and given to mankind, this number has made us immensely technologically powerful. To accurately compute π, an iterative method called the Monte Carlo Method is implemented in the following diagram:

#(1)
Total Number of points: 0
Points within circle: 0
Pi estimation:
#(2)
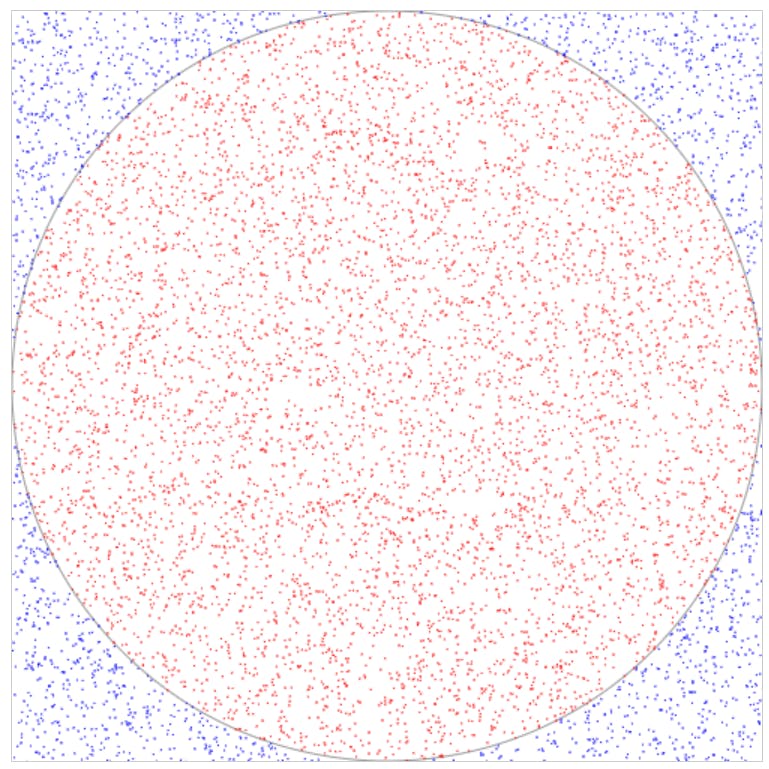
Total Number of points: 825
Points within circle: 663
Pi estimation: 3.21455
Randomly generating points on this plane, red points lie within the circle whereas blue points lie outside the circle. π is the ratio of the area and the radius squared. π can therefore be estimated by computing the ratio of the number of points in the circle with the total number of points across the square.
#(3)
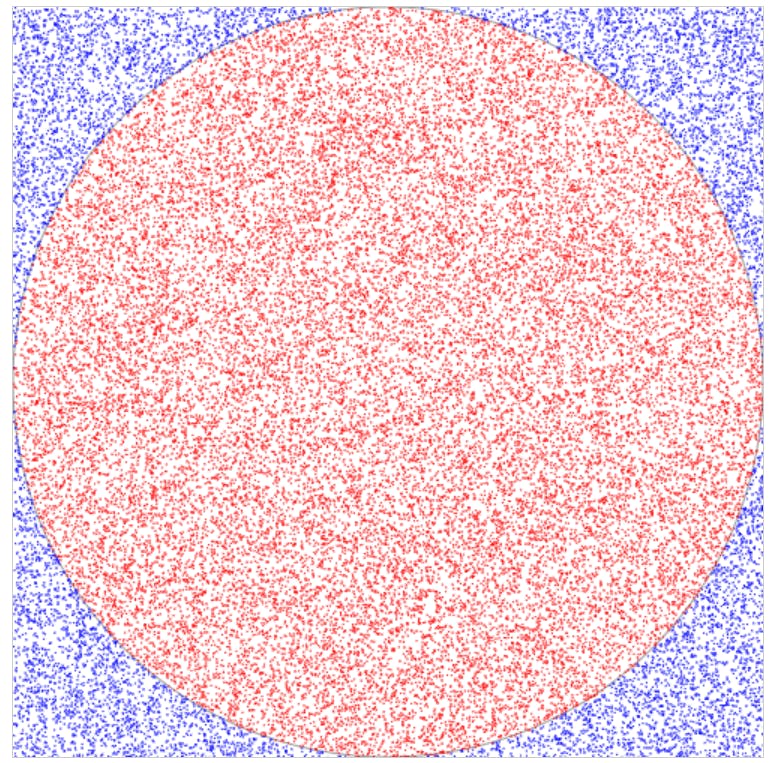
Total Number of points: 18505
Points within circle: 14528
Pi estimation: 3.14034
When the points are randomly placed on the board we see that a low resolution of the estimation of pi is generated with a few iterations. We aim our ideals in and between boundaries to create a structured view of the world. Similarly, the story of human experiences is being ever randomly generated, widely different across cultures, and seemingly dispersed and alien to one another when observed minutely.
#(4)
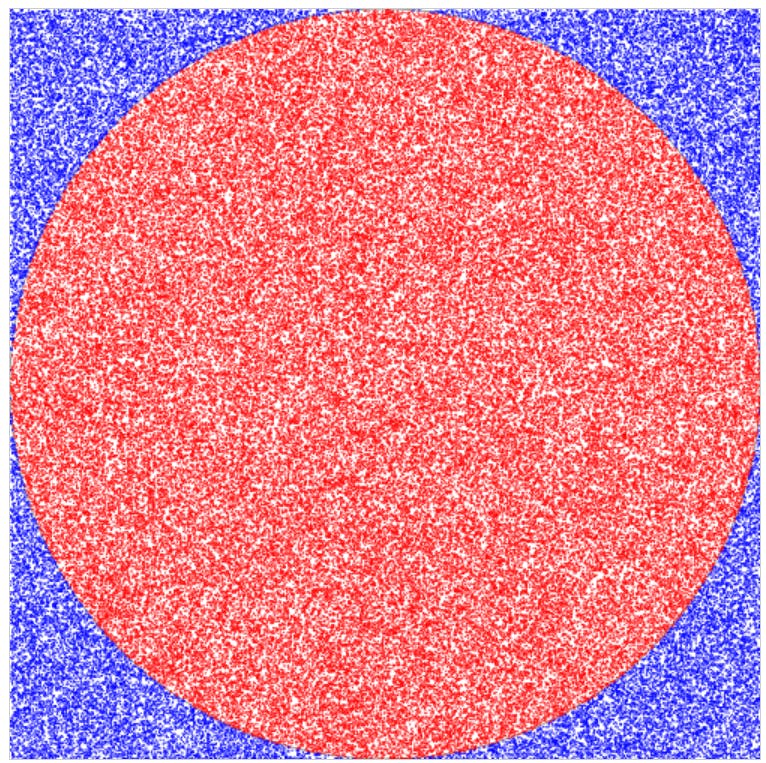
Total Number of points: 39265
Points within circle: 30775
Pi estimation: 3.13511
#(5)
Total Number of points: 130864
Points within circle: 102580
Pi estimation: 3.13547
Over multiple iterations, our approximation for π becomes narrows closer and closer to the value of pi. Likewise, as stories and wisdom are passed from generation to generation, wisdom accumulates into the formulation of stories integral to the culture. As time progresses, the archetypes that are described become more and more accurate towards the true nature of human existence. It is the story of Judeo-Christianity. It is the story of Islam. It is the story of Hinduism and Taoism.

#(6)
Total Number of points: 273465
Points within circle: 214685
Pi estimation: 3.14122
Finally (although it can never be so final), our capabilities in time have been exhausted to formulise a value for pi. The most complete story is one that has been iterated across generations and cross-culturally. This is the story that unifies us all — the meaning is the same but its description is uniquely dependent on the local that it emerged.
I believe this to be the true formalism of every religious story across the world. In a low-resolution image, Christianity was not concrete and did not take dramatic flight immediately after the crucifixion of Christ, but rather hundreds of years after. Similarly, nor did the Islamic tradition solidify until 400 years after the death of the Prophet Mohammed.
Plotting the estimated value of π against the total number of random points placed on our board.
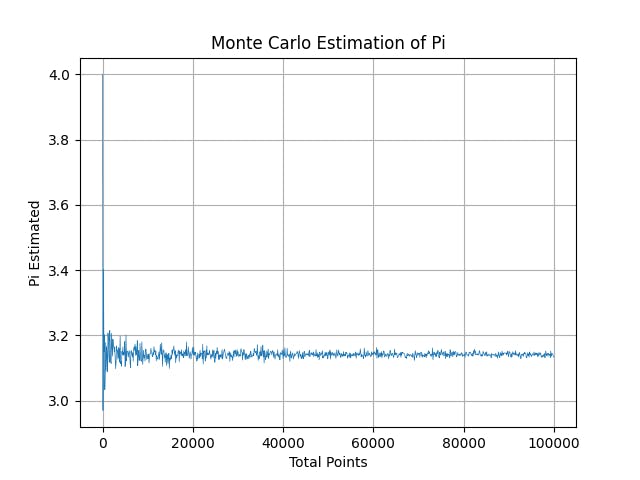
Something I am incredibly surprised by is that the value for π, estimated by iterations, doesn’t stay fixed or become more precise on a single value. Instead, it deviates back and forth across the value. I’m amazed by this since that is reflective of the culture that we exist within today.

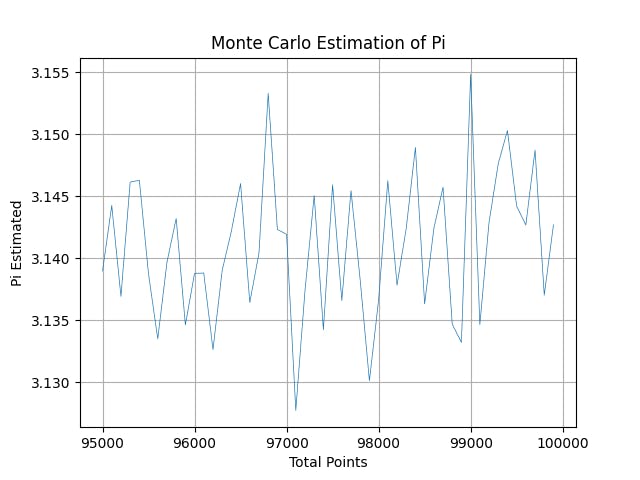
We aim at an ideal by acting out dramas and stories across a multiplicity of iterations, however, because of our intrinsic nature to aim incorrectly (or ‘sin’), we continuously traverse around our ideal without ever getting to it. Even more surprising is that the deviations over time do not diminish as you would expect for something being aimed and a model which gets ‘better’. This constant fluctuation highlights that even the prophets themselves are not ‘ideal’ or perfect from any given perspective. We see this over the years in our mode of government, where the management of principles shifts and changes from creative rejuvenation and conservative traditionalism. If nature tells us that the spring, once stretched and released should lose energy and converge to equilibrium, what is keeping this never-ending fluctuation from ceasing to exist? God? The spirit? Humanity? Love? And if — let’s say if — we did strike a utopian ideal, where would be the adventure? What could be next if everything was perfect?
God forbid, we can’t achieve an ideal state. In fact, the ideal state is the one which shifts around the ideal.
I hope you’ve enjoyed reading this article. Religious ideas are unique in that there are an infinite number of depths and dimensionalities one can philosophically explore. I am trained in the Sciences and can relate deeply to ideas I’ve discussed previously. If you would like to try out some of the code I’ve created for these diagrams, please copy the code below into your Python IDLE or wherever you run your code.
import random
import matplotlib.pyplot as plt

# Number of total points to generate
total_points = 1000

# Number of points inside the circle
points_inside_circle = 0

# Lists to store x and y coordinates of points for plotting
x_inside_circle = []
y_inside_circle = []
x_outside_circle = []
y_outside_circle = []

# Generate random points within a square of side length 2
for _ in range(total_points):
    x = random.uniform(-1, 1)
    y = random.uniform(-1, 1)

    # Check if the point is inside the circle
    if x**2 + y**2 <= 1:
        points_inside_circle += 1
        x_inside_circle.append(x)
        y_inside_circle.append(y)
    else:
        x_outside_circle.append(x)
        y_outside_circle.append(y)

# Estimate pi using the formula for the area of a circle
# (pi * r^2) / (2r)^2 = pi/4
pi_estimate = 4 * points_inside_circle / total_points

print("Estimated value of pi:", pi_estimate)

# Plot the points within and outside the circle
plt.scatter(x_inside_circle, y_inside_circle, color='red', label='Points Inside Circle')
plt.scatter(x_outside_circle, y_outside_circle, color='blue', label='Points Outside Circle')
plt.xlabel('X')
plt.ylabel('Y')
plt.title('Monte Carlo Estimation of Pi')
plt.legend()
plt.show()
#_______________________________________________________________________ _
##Creating a line graph of the value of pi vs the number of scattered points


import random
import matplotlib.pyplot as plt

# Lists to store total_points and pi_estimated values
total_points_list = []
pi_estimated_list = []

# Loop through different values of total_points with steps of 100
for total_points in range(1, 100, 10):
    points_inside_circle = 0

    # Generate random points within a square of side length 2
    for _ in range(total_points):
        x = random.uniform(-1, 1)
        y = random.uniform(-1, 1)

        # Check if the point is inside the circle
        if x**2 + y**2 <= 1:
            points_inside_circle += 1

    # Estimate pi using the formula for the area of a circle
    pi_estimate = 4 * points_inside_circle / total_points

    # Append total_points and pi_estimate to the lists
    total_points_list.append(total_points)
    pi_estimated_list.append(pi_estimate)

# Plot total_points vs. pi_estimated as a line graph
plt.plot(total_points_list, pi_estimated_list)
plt.xlabel('Total Points')
plt.ylabel('Pi Estimated')
plt.title('Monte Carlo Estimation of Pi')
plt.grid(True)
plt.show()